Sage Group
Is this trend a good trading opportunity?
Will Sage Group turn, or will it continue to rise beyond 675p August highs?
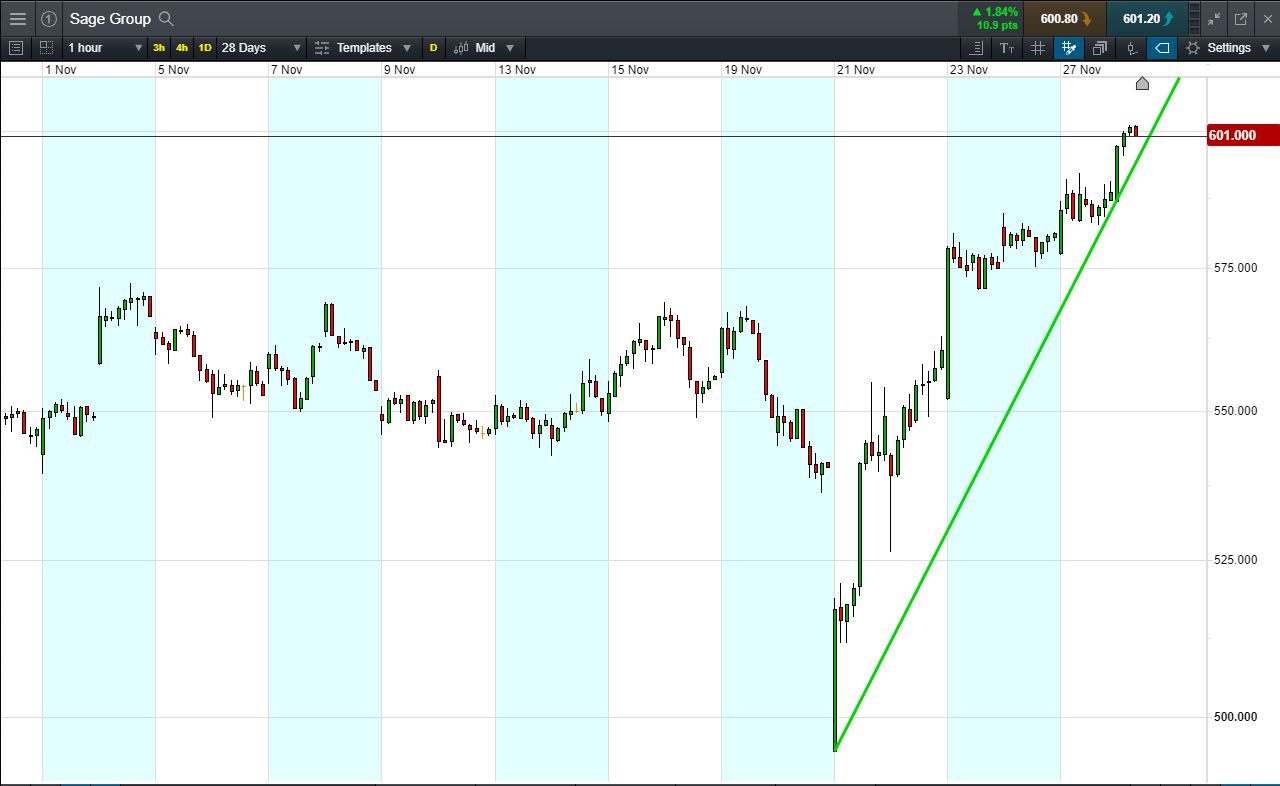
- The chart shows Sage Group price action in November.
- Shares +12% in the past week, now at 601p (at the time of writing).
- Shares -28.5% from 2018 highs; +20% from 2018 lows; -24.7% year-to-date.
- IT company’s shares in a weeklong uptrend, strong bounce after results last week.
- Will this momentum continue?
- Source: Bloomberg, FT, Reuters, DJ Newswires
Click to enlarge
Trading Sage Group – An Example
Let’s say the trend appeals to you, you think it’s likely to continue. You decide to buy exposure to £10,000 worth of Sage Group using a CFD, at the current price of 601p. To do this, you need £2,000.
Let’s assume the Sage Group trend continues to August highs of 675p (+12.3%). Your profit would be £1230, from your initial investment of £2,000.
Conversely, let’s assume you open the above position, and place a stop-loss at 4% from the current price. Sage Group falls 4% and hits your stop-loss. Your loss would be £400.
This is provided for information purposes only. It should not be taken as a recommendation.