X

Get our occasional Market Report emails

sent straight to your inbox

There’s no charge for this.

Getting latest data loading
Home / Special Reports / What to buy during a market sell-off

This report is not a personal recommendation and does not take into account your personal circumstances or appetite for risk.

4 November 2018

What to buy during a market sell-off

Halloween may be behind us, but London investors are still feeling spooked by the general equity sell-off that left no stone unturned and sent the blue-chip UK Index index as low as 9% down, a mere whisker away from a 10% technical market correction.

But while the UK Index may be down a full 11% off its best levels seen in late May, there are plenty of exciting trading opportunities to take advantage of today.

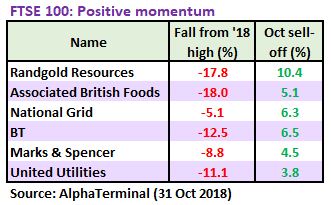
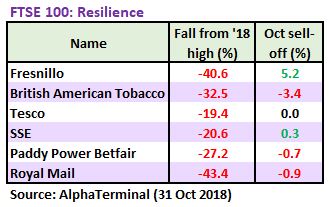
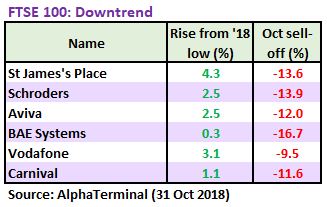
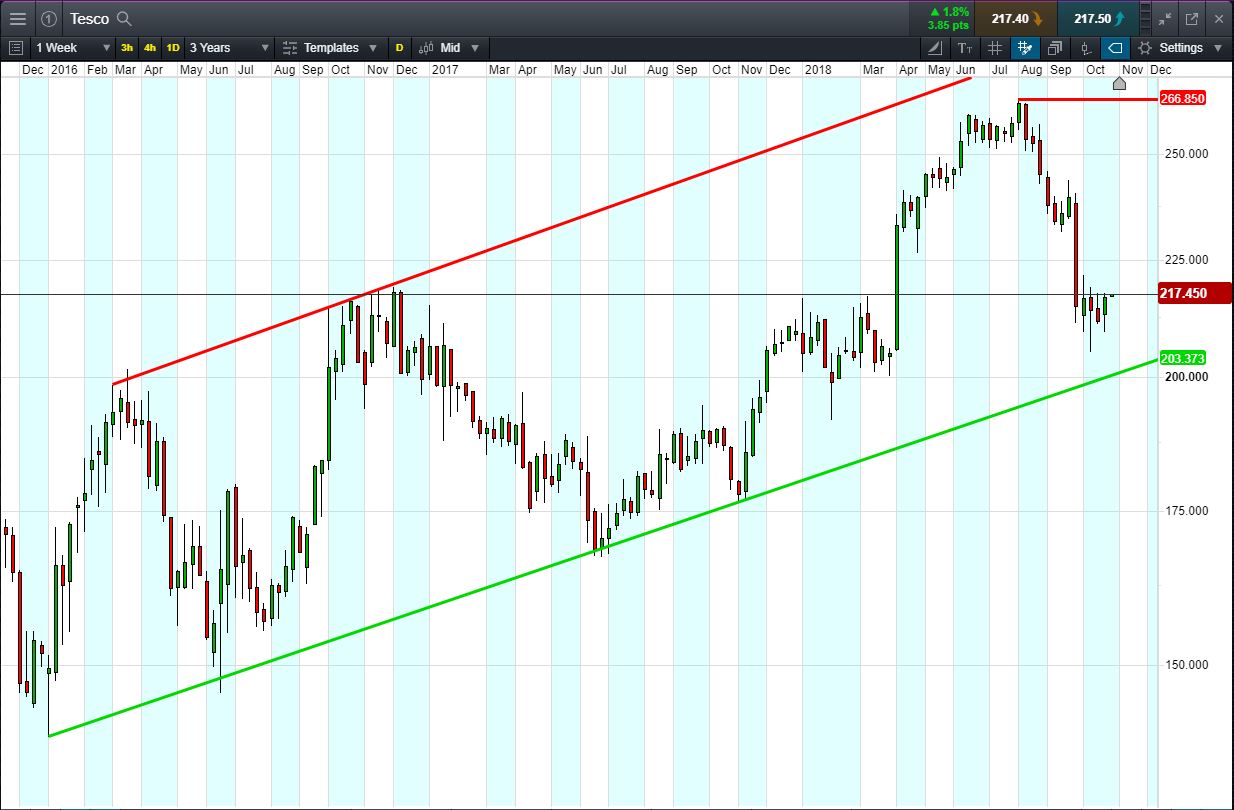
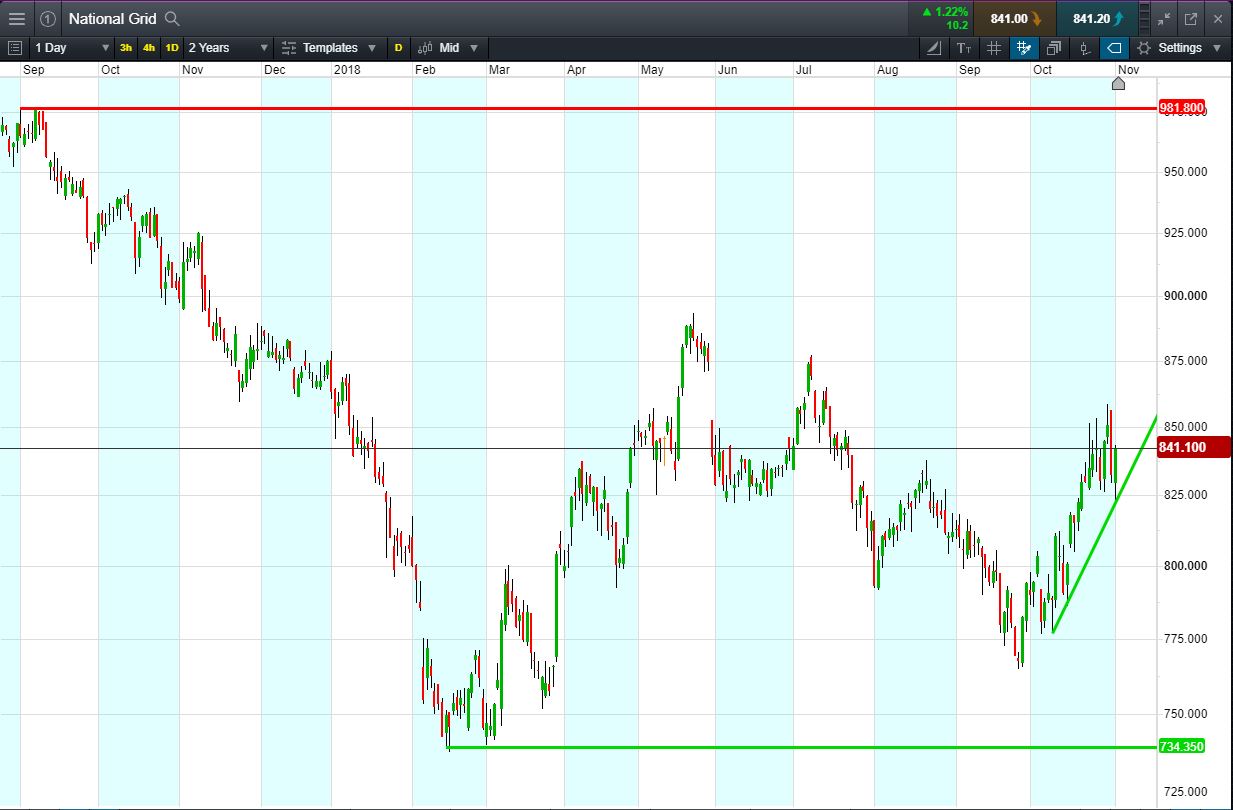
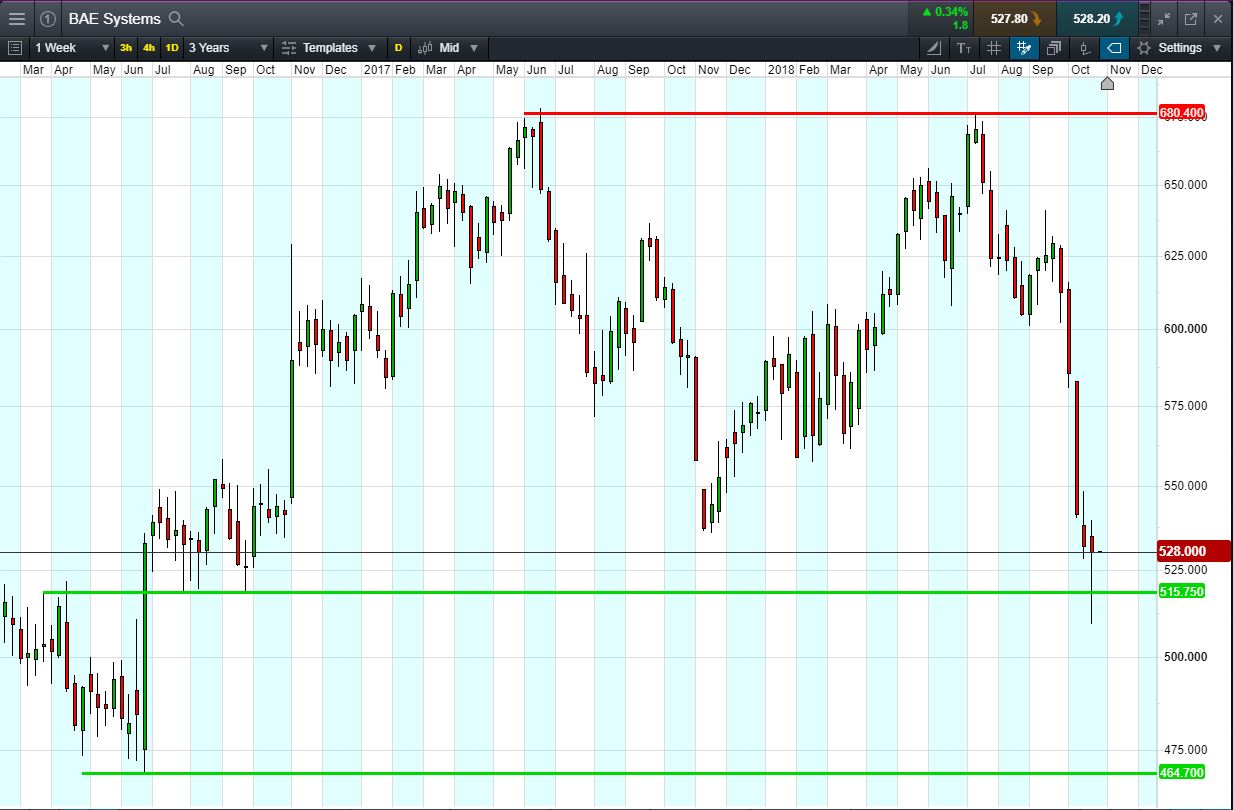
The following report will look at the origins of the current bearish sentiment, examine the reasons for trading during a sell-off and give you a full overview of several UK Index stocks defying the downtrend.

Is there a Goldilocks trading opportunity in-play today? We have found several. Continue reading to find an opportunity just right for you.

Natural reaction

The most recent stock market correction began on 3 October when the UK Index was trading around 7530 level. The initial sharp sell-off continued over the following 6 trading days to 6923 lows.

The fall did not stop there, although its pace slowed down, and the UK Index went on to lose another 70 points to trade close to the 2018 low of 6839. The index is off its worst levels for now, but it is far from clear if the final curtain already rose over the sell-off.

There are many reasons for this market correction. Some economists point to the continued lack of a final Brexit deal with less than half a year remaining until UK exits the EU, adding to business uncertainty.

Others blame the ratcheting of the Sino-US tensions that has hammered shares of London-based multinational companies which depend on international trade.

The latest consensus points to the mixed Q3 earnings season in the United States, with many global growth barometers such as Amazon, Caterpillar and General Electric missing the analysts’ earnings expectations.

Mixed corporate results highlighted the issue with ballooning equity valuations that are underpinned by share buybacks and distortionary liquidity rather than genuinely strong trading fundamentals. The current sell-off appears to be a healthy market reaction to correct these market imbalances.

Longer-term perspective

It is also important to keep bearish sentiment in perspective. The October fall may seem dramatic, but this is hardly the first sell-off in recent memory.

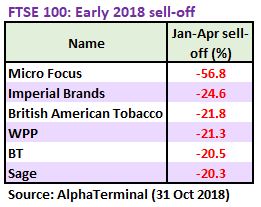
Beginning in January 2018, the UK Index fell 950 points (13.8%) over a 2-month period. The sell-off started in the United States, as expectations grew that the Fed would continue raising interest rates to combat growing inflation under the freshly appointed Chairman Jerome Powell. The era of cheap money was coming to an end and it was high time for a correction in global equities, overvalued relative to their fundamentals.

The negative sentiment spread across world markets, the UK Index losing close to 200 points (-2.6%) on 6 Feb, its worst trading session since Brexit.

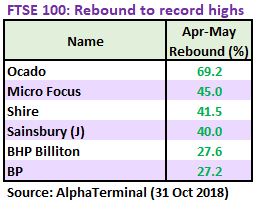
And yet, despite these bruising losses, the UK Index proved resilient. After reaching the bottom of the sell-off in late March, it would go on to rally over 15%, recovering all earlier losses and reaching record high levels in late May.

For continuing analytical coverage of UK and international markets, you can also sign up to have our research sent directly to your inbox.

Page: 01

It’s Always Darkest…

The biggest underperformers during the early 2018 market correction have been companies that published disappointing results, as well as those hit by changes in the wider macroeconomic environment. Overall, 84 of 100 UK Index components went negative during the period.

Micro Focus issued dual profits warnings in early January and late March, with the CEO leaving after the second alert. Shares of accounting software company Sage fell when Q1 results fell short of expectations. Advertising agency WPP also cut its earnings targets in March and reported a slow start to 2018. Fixed-line telecoms group BT, meanwhile, faced structural issues with its business.

Imperial Brands and British American Tobacco also struggled to adapt to the changing financial environment. For several years running, the two international tobacco manufactures benefited from low yields of US government bonds, with investors preferring defensive tobacco stocks over low-yielding bonds. As the bond yields started to grow again at the beginning of the year, Imperial Brands and BAT became a target for a sell-off.

… Before the Dawn

The January-April correction seemed like trouble for the UK Index , but the 11% correction proved to be a golden opportunity for investors to take stock of their financial portfolios and re-evaluate their trading goals.

Only 16 UK Index components remained positive during the period (9 of them gaining less than 5%), which meant that there was an open field of undervalued bargain stocks to pick from.

Some of them still faced commercial issues, but many others remained fundamentally sound. With the correction over, these UK Index stocks went on the “offensive”. The blue-chip index itself shrugged off the negativity and rose from 6839 on 23 March to record highs of 7903 on 22 May, a 15.5% rally in 8 ½ weeks.

In individual stocks, Ocado was the biggest winner, its shares rising close to 70% after the online grocer signed a lucrative partnership with the biggest US supermarket chain Kroger. The struggling software company Micro Focus rebounded from the earlier sell-off after traders sensed that its low share price represented a bargain.

Specialty pharmaceutical company Shire started takeover negotiations with Japanese peer Takeda, with its shares further benefiting from the cheaper GBP against the Japanese Yen. M&A activity also helped Sainsbury, after it struck a deal with the US retailer Walmart for a merger of Sainsbury and ASDA, which would create the largest British supermarket chain. The UK Index rally happened on the backdrop of sharply rising oil prices, which helped BP, but also the Australian miner BHP Billiton, which at the time owned significant petroleum assets.

A rising tide raises all ships and the first quarter UK Index sell-off proved to be an excellent opportunity to buy stocks at bargain prices right before a massive 15% rally.

Why get involved now?

The UK Index is off its worst levels, but its future is still uncertain. Many investors still ask themselves if the correction would continue, or if London’s blue-chips would rally back to summer highs. Why is now the best time to get involved in the markets?

In the words of the legendary business leader Warren Buffett, a wise investor should be “fearful when others are greedy and greedy when others are fearful.”

The logic behind Buffett’s statement is simple and straight-forward. The price of shares is determined by current supply and demand (i.e. traders buying and selling). But the intrinsic value of shares comes from discounting all future cash flows to the present, on the assumption that investors buy the right to receive regular revenue from the company in the form of dividends, capital returns, etc.

When most investors are “greedy” (read: bullish, buying shares en masse), prices typically rise, bringing them closer to intrinsic value, or even above it. Shares become overpriced and an investor’s potential return on equity decreases. However, when investors are “fearful” (i.e. selling shares), the opposite happens. The share price eventually falls below the stock’s intrinsic value.

When everyone else is selling and shares fall, Buffett advises the smart investor to be greedy and buy equities, receiving the full intrinsic value of shares (i.e. dividend payments), at a fraction of the implied equilibrium price. And when the market sentiment eventually recovers, with shares bouncing back, shareholders can benefit the second time from the speculation. Or, in the simplest terms, “Buy low and Sell high”.

Playing the contrarian

Keep in mind that prolonged market rallies and sell-offs only enhance Buffett’s maxim. When markets are in a rapid uptrend or downtrend, investor sentiment (fear and greed) becomes more pronounced, due to the concern over missing out or worries about already incurred financial losses. As the markets are falling, these fears grow, prompting panic selling and pushing shares into ‘undervalued’ territory even faster than normal.

The sell-off begins with the most vulnerable stocks, companies experiencing commercial difficulties or operating in challenging market conditions, but at the peak of the ‘Bear Run’, even the most fundamentally sound companies become cheap. This is where an astute investor steps in and takes action to buy bargain-priced shares when everyone else is caught up in the negative sentiment.

Or, in the words of the 19th century banker Baron Nathaniel Rothschild: “The time to buy is when there's blood in the streets, even if that blood is your own.”

Don’t call the UK Index ’s bottom

Does Buffett’s principle of “contrarian” investing mean that investors should buy their favourite stock every time when the market has sold-off, or should they be pickier about trading during a downtrend?

It is important to keep in mind is that calling a market bottom can be tricky even for the most experienced market watchers. The ongoing uncertainty over Brexit, the weakened state of the European economy and the US-China trade wars means that predicting the future of the UK Index is a futile and counterproductive effort. Similar economic and geopolitical uncertainties are typically present during most market sell-offs and crashes.

Rather than looking at the UK 100 index as a whole and trying to guess the point of reversal, where UK Index will turn and resume bullish movement, a careful investor should instead examine individual UK Index components. These blue-chip stocks can often represent a solid investment and move in the opposite direction from the downbeat stock market.

The reason why individual stocks can buck the overall negative trend can be diverse. Some companies can outperform the UK Index because of their exposure to international markets where trading conditions are more favourable.

Others benefit from paying large dividends, attracting long-term investors who are looking for a reliable cash flow during the downtrend. For example, steelmaker Evraz is forecast to pay a 12.44% dividend yield, the highest on UK 100 ; Evraz shares +58% year-to-date. (Source: Alpha Terminal, 1 November 2018)

Some companies have a fundamentally non-cyclical business models, for example, energy & water utilities or fast-moving consumer goods, insulating them when the general market turns bearish.

Picking the winners

The key to successful trading during a downtrend is to set strict criteria for picking interesting tradable opportunities. Because a sharp market sell-off can an unusual event to many retail investors, it is important to get out of the trading comfort zone and widen your trading horizons to the remainder of UK 100 list of blue chips, or, for the more daring, even to mid-caps.

Instead of focusing on just the usual suspects, which could be trading in-line with the overall bearish market (or even underperforming it), a better approach would to devise a set of trading criteria for picking stocks and look for blue chip stocks that satisfy these criteria.

It is equally important to maintain trading discipline. A market sell-off can see dramatic share price swings, but if you stick to your trading rules, respect key support & resistance levels and don’t prematurely call the market low, even the most volatile of bear markets can present exciting opportunities to buy and sell shares.

Turn the page to see some examples of technical criteria for picking stocks during market downturn, which we can group under several distinct categories.

Resilience

These stocks have fallen significantly from 2018 lows, presenting a bargain opportunity. They have been resilient during both 2018 stock market corrections, losing only a relatively small portion of the share price or even gaining in value. At the same time, they have already bounced 10-15% away from 2018 lows, or from a key support level.

Stocks in this category sit in the “Goldilocks” zone in terms of a trading opportunity. On one hand, they have demonstrated resilience to the latest correction, giving investors a sense of security. On the other hand, they are still far away from this year’s highs, offering a high upside potential in case the market sentiment turns and the stock market rallies back to new record highs.

Downtrend

These stocks have been trending lower even before the recent sell-off. Their share price shows several weeks of negative momentum, with shares now trading close to 2018 lows and close to long-term support levels.

This presents a dual trading opportunity for retail investors. Some traders can try selling these shares short, to benefit from the strong negative momentum that is pulling these shares down regardless of whether the overall UK Index is trending higher or lower. Short-selling is not for everyone, of course. Investors who prefer to exclusively ‘go long’, can buy these shares when they hit a key support level if they believe that the shares have been oversold and their greatly reduced share price represents a bargain.

Over the next several pages we examine several key stocks that have fit the above criteria in more detail, including charts, brokers comments and technical analysis.

If any of those shares feel like an opportunity for you, get in touch with one of our brokers to discuss your options.

Positive Momentum

In this category we have shares that are bucking the negative trend and rising higher despite the market sell-off.

These shares have typically seen several weeks or months of positive momentum and are currently trading close to 2018 highs, with a potential to break out to new record highs. There are fundamental reasons why these stocks are outperforming the market, e.g. high commodity prices, high dividend yields, defensive nature of the business.

Page: 02

Tesco

Source: CMC Markets, 1 November 2018

Will Tesco return to August highs of 266p (+22.6%) or fall to Nov 2017 lows of 175p (-19.4%)?


  • Long-term rising channel since 2016, with the latest bounce from channel floor a year ago.
  • Shares currently nearing rising support level around 200p.
  • Shares -20% from 2018 highs; +12.2% from 2018 lows; +3.9% year-to-date.
  • Despite the bearish market, Tesco shares have been showing resilience to the downturn.
  • Shares fallen just 2.4% during the January-March correction and were flat during the October correction.
  • Brokers are largely positive, with 86% of analysts saying either “Buy” or “Hold”
  • Bullish attitude is further supported by 88% of analysts forecasting a higher share price within 12 months.


Broker Consensus: 59% Buy, 27% Hold, 14% Sell
Bullish: Macquarie, Outperform, Target 300p, +38.2% (10 Oct 18)

Average Target: 258p, +19% (1 Nov 18)

Bearish: Exane BNP Paribas, Underperform, Target 205p, -5.5% (12 Oct 18)


Pricing data sourced from Bloomberg on 1 November 2018. Please contact us for a full, up to date rundown.

National Grid


Source: CMC Markets, 1 November 2018

Will National Grid rise to Sep ‘17 highs of 981p (+16.6%) or retreat to Feb lows of 734p (-12.7%)?


  • Shares of gas & electricity utility company National Grid have defied the recent bearish trend.
  • Instead of falling in October, shares are on a 10% month-long uptrend from September’s 760p lows.
  • Shares are just 7% away from 2018 highs, having bounced +13% from 2018 lows; -4% year-to-date.
  • National Grid shares have been resilient during the 2018 sell-off, losing just 10% during the January-March correction and gaining +6.3% during the October correction.
  • Utility companies, with their high dividend yield (National Grid: 5.7%) and non-cyclical/defensive products, are an attractive investment option during market downtrends.


Broker Consensus: 55% Buy, 45% Hold, 0% Sell
Bullish: Macquarie, Outperform, Target 1050p, +24.9% (27 Sept 18)

Average Target: 926.47p, +10.2% (1 Nov 18)

Bearish: Day by Day, Sell, Target 702p, -16.5% (22 Oct 18)


Pricing data sourced from Bloomberg on 1 November 2018. Please contact us for a full, up to date rundown.

BAE Systems

Source: CMC Markets, 1 November 2018

Will BAE bounce to Summer highs of 680p (+28.8%) or continue to May 2016 lows of 464p (-12.1%)?


  • Shares of the defence & aerospace company BAE Systems have fallen off sharply on the back of uncertainty surrounding military exports to Saudi Arabia.
  • Saudi business generated 16% of company’s total sales in 2017 and any military export sanctions against the Kingdom could jeopardise the company’s revenue projections. (Source: FT)
  • BAE Systems shares are 22.7% below their 2018 highs, now trading just 3.8% away from 2018 lows.
  • During the Jan-Mar correction, BAE Systems shares lost just 4.3% (but already -16.7% in October).
  • Shares are now approaching 515p support level last seen in July-September 2016.
  • Resolution of the US-Saudi standoff could help the shares recover to summer highs around 680p.


Broker Consensus: 74% Buy, 17% Hold, 9% Sell
Bullish: Investec, Buy, Target 820p, +55.3% (3 Aug 18)

Average Target: 684.63p, +29.7% (1 Nov 18)

Bearish: Raymond James, Underperform, Target 500p, -5.3% (17 Oct 18)


Pricing data sourced from Bloomberg on 1 November 2018. Please contact us for a full, up to date rundown.

Page: 03

Want to take advantage of the above opportunities right now?

Whether you see UK Stocks going up or down for the remainder of the year, tradable opportunities will present themselves regularly. We’re here to help you weed them out and capitalise on them. Accendo Markets can help you increase your profit potential with the use of leveraged instruments such as CFDs, a flexible alternative to traditional shares that is currently exempt from UK stamp duty.

CFDs: Like shares, but more flexible

While buying 15,730 shares in Lloyds Banking @ 63.57p requires an outlay of around £10,000 plus commission, the same exposure via a CFD requires about £2,000 plus commission (see right-hand box; margin + costs). If a trader invests in Lloyds Banking, one would assume they believe the share price is likely to move in their favour. After considering the ‘worst case scenario’ and assigning funds to cover it, the trader may conclude there’s little point in exposing the full £10,000 to Lloyds Banking shares - some of that capital could be put to good use elsewhere in the markets. (Source: CMC, Prices indicative)

CFDs are leveraged instruments, but you don’t have to use leverage

If you had, say, £10,000 to invest in the stock market, you could deposit that amount into a share dealing account and purchase shares in a company. You would pay commission to open the position, 0.5% in stamp duty and the full £10,000 will be tied up in your chosen shares with any profit or loss based on that exposure. The same £10,000 worth of exposure can be secured with a CFD for a fraction of the initial outlay thanks to leverage, with the risk and reward the same as if £10,000 worth of traditional shares were held. But should you not be interested in leverage, you can always treat CFDs like shares. Simply deposit £10,000 into a CFD trading account and take the equivalent CFD position which will tie up as little as 20%/£2,000 (note that overnight financing costs will still apply). The remaining £8,000 is not tied up, so you can use some of that to take advantage of another short-term opportunity elsewhere, or simply leave it on the account to support any losses. Best of all, using a CFD means you pay no stamp duty!

What’s your view?

Think shares will rise? Take a long position by buying CFDs (buy low, aiming to sell high). Think they’ll fall? Take a short position by selling CFDs (sell high, aiming to buy low). For a more detailed rundown of CFDs, their mechanics, associated costs and some trading scenarios download our ‘Comprehensive Guide to CFDs’ here.

Page: 04

The Accendo Markets Research Offering

Does your current broker’s morning report tell you all you need to know about yesterday’s news? If so, how is it offering you anything more than the plethora of information already available on the internet?

We are proud that our morning editorial has become a hot commodity in the City, its content quoted daily by the journalists that are writing the news everyone else will be reading later in the day, if not the next. Our morning report tells you what is driving the market at that moment and what to look out for in the day ahead.

If a company has reported earnings before the market opens, we will tell you why the shares are called to open higher or lower in relation to that announcement.

As well as the Morning Report, signing-up to Accendo Markets Research & Trade Ideas offers you the chance to receive the following publications:

  • Trading Opportunities: A daily selection of key level and event alerts on various stocks, including:


  • Breakouts
  • Momentum
  • Dividends
  • Ranges
  • Support & resistance levels
  • Companies reporting results
  • Broker upgrades & downgrades
  • Fallers / stocks & markets at lows


  • Trade Alerts: Trading ideas from our analysts. What do they think is likely to move?
  • Week in Advance: A summary of next week’s key events. Is there a trading opportunity there for you?

To ensure you can act as quickly as possible, you will receive an email with a link to the latest publication as soon as it is released. You can unsubscribe from these emails at any time.

Based on a wealth of experience, gained from both large and small institutions, our Research and Trade Ideas are produced in-house. Our team of dedicated professionals comprises both analysts and traders, drawing upon a wide range of resources and methodologies.

Our aim is to provide you with the manpower and expertise you need to help you clarify, interpret and capitalise on the ever-growing volume of market information.

The journalists do not pay for it and neither do you, so why not give it a go? You have nothing to lose and perhaps a little more to gain…

Page: 05

This research is produced by Accendo Markets Limited. Research produced and disseminated by Accendo Markets is classified as non-independent research, and is therefore a marketing communication. This investment research has not been prepared in accordance with legal requirements designed to promote its independence and it is not subject to the prohibition on dealing ahead of the dissemination of investment research. This research does not constitute a personal recommendation or offer to enter into a transaction or an investment, and is produced and distributed for information purposes only.


Accendo Markets considers opinions and information contained within the research to be valid when published, and gives no warranty as to the investments referred to in this material. The income from the investments referred to may go down as well as up, and investors may realise losses on investments. The past performance of a particular investment is not necessarily a guide to its future performance.

Prepared by Michael van Dulken, Head of Research
Spread bets and CFDs are complex instruments and come with a high risk of losing money rapidly due to leverage.
Spread bets and CFDs are complex instruments and come with a high risk of losing money rapidly due to leverage. 67% of retail investor accounts lose money when spread betting and/or trading CFDs with this provider. You should consider whether you understand how spread bets and CFDs work and whether you can afford to take the high risk of losing your money.
.