The situation on the UK 100 this week can best be described as a bloodbath. The week started with news that the number of new coronavirus (COVID-19) cases had exploded in Italy, South Korea, Iran and Afghanistan, sending shockwaves through the global stock markets.
What has followed from Monday is a relentless selloff in almost all major global stock markets, from Asia to Europe and to the US. The UK 100 witnessed a selloff in a scale not seen since the global economic meltdown of 2008, as it tore through all major support levels that have been identified in our previous analyses.
Many stocks that lost ground on the UK 100 this week suffered double digit percentage losses; a situation not seen for quite some time. Additionally, NMC Health, which has had a topsy-turvy start to the year, has placed its Chief Executive on suspension as the UK government launches an investigation into the company’s affairs, following the whistleblower report in December 2019 which alleged that the company was overstating its revenues. Trading on this stock is now suspended.
Not a single stock gained ground on the UK 100 . Rather, the index’s top losers for the week is populated by companies in the travel and luxury brand business sectors; sectors greatly hit by the coronavirus outbreak.
- EasyJet (-29.93%)
- TUI AG (-28.35%)
- International Consolidated Airlines Group (-24.88%)
- WPP (-23.70%)
- Carnival (-23.44%)
Barclays, Burberry and Lloyds Banking Group were among prominent losing stocks for the week, as they shed 17.58%, 15% and 13.01% respectively.
All price gains and losses are current as at 9:38am GMT.
Technical Outlook for UK 100
The steep fall in the UK 100 smashed through all previously identified support levels and also broke below the 200-SMA line; a critical dynamic support level. Price action was able to find support at the 6517.5 price level. This remains the support target that is of current interest to present price activity.
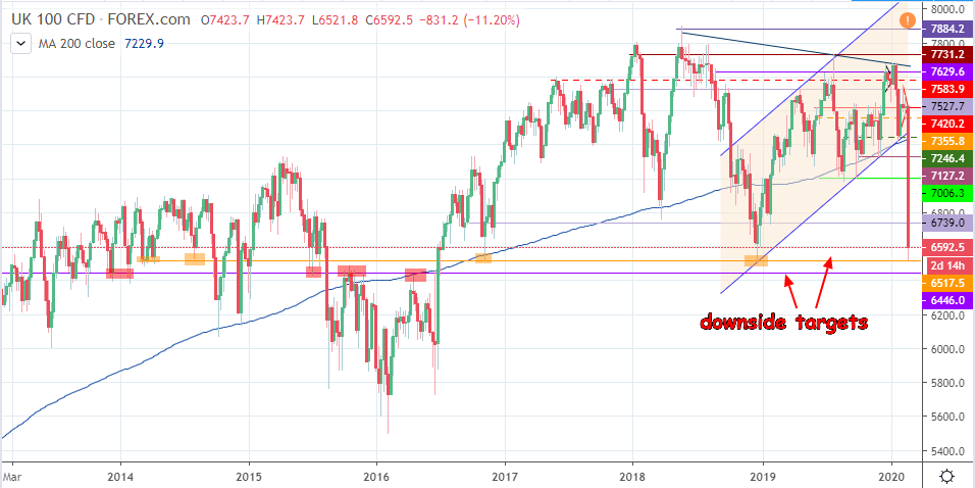
UK 100 Weekly Chart: February 28, 2020
The price action on the daily chart reveals that the symmetrical triangle of last week’s chart was broken comprehensively to the downside. Price action on the UK 100 has also broken down the channel’s lower border.
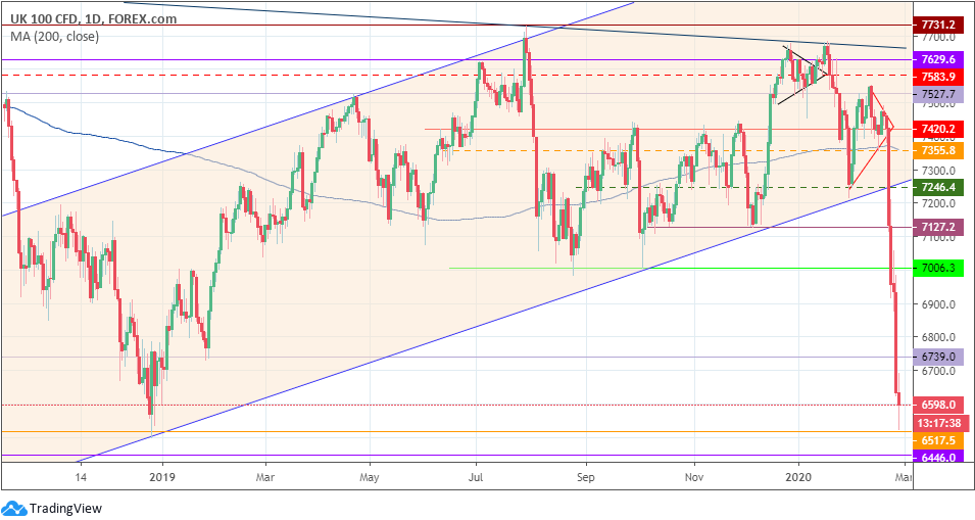
UK 100 Daily Chart: February 28, 2020
Today’s price action showed that the UK Index opened to the upside, but any hopes of a positive day are fast disappearing as the sellers have come in hard and fast to send the index lower. The UK 100 has bounced off the 6517.5 support (7 Nov 2016 and 26 Dec 2018 lows), but still looks set to challenge this support level.
A breakdown of the 6517.5 support area will open the door towards next support target at 6446.0, which is a price area that was last seen on 6 July 2015. 6373.5, 6204.6 and 6015.5 remain sequential support targets that could be in line if the selloff on the UK 100 is able to force prices below 6446.0.
On the flip side, if the present support level at 6517.5 stands firm, we could have a situation of a transient recovery, where 6739.2 (28 Jan 2019 low) could be the next resistance target. Further recover brings 7006.3 into focus.
Bulls
Only a break above 7006.3 will suffice to get bullish attention back into the UK 100 .
Bears
Bears will only need to see a breakdown of 6517.5 to see continued downside on the UK 100 .
Prices to watch: 7006.3 (bulls) and 6517.5 (bears).