The biggest news out of the UK this morning is the resounding election victory of the UK PM Boris Johnson and his Conservative Party, which has guaranteed the Tory party a majority in the UK Parliament and a straight path towards an orderly Brexit. The UK markets are loving this too, as the UK 100 is posting strong gains this Friday morning on the election outcome.
There was also some breaking news late last night on a possible trade agreement in principle between the US and China, which is supposed to get the approval of US President Donald Trump before it is signed by both sides. This capped off a day in which risk sentiment rose as President Trump tweeted about a “big deal” between both sides.
Leading the top gainers for this week was the Royal Scotland Bank Group with a massive 13.18% gain achieved so far this week. Other top gainers on the UK 100 include:
- Persimmon Co (11.86%)
- Hargreaves Lansdown (10.84%)
- Berkeley Group Holdings (10.25%)
- Barclays (9.47%)
- Tesco (8.48%)
- Kingfisher (7.73%)
- Lloyds Banking Group (7.35%)
Rentokil Initial has dropped 3.32% this week to occupy the position of the top loser. The Rolls Royce Group follows closely with a 2.87% loss. Here’s how other losing stocks on the UK 100 performed this week:
- Bunzl (-2.77%)
- Coca Cola HBC (-2.59%)
- Diageo (-2.06%)
- Morrison (WM) Supermarkets (-1.81%)
- Segro (-1.50%)
Technical Outlook for UK 100
The lower tops on the monthly chart remain intact and therefore the long-term outlook remains unchanged.
However, a look at the weekly chart shows some changes from last week. Price was able to find support at 7127.2 after breaking the channel’s lower border. However, the price bounce at 7127.2 for the weekly candle was able to take the price action back into the channel, where it now targets the upside target at the 7420.2 resistance line. As such, the 3% penetration close of the weekly candle below the channel’s lower border did not occur and therefore the channel remains intact.
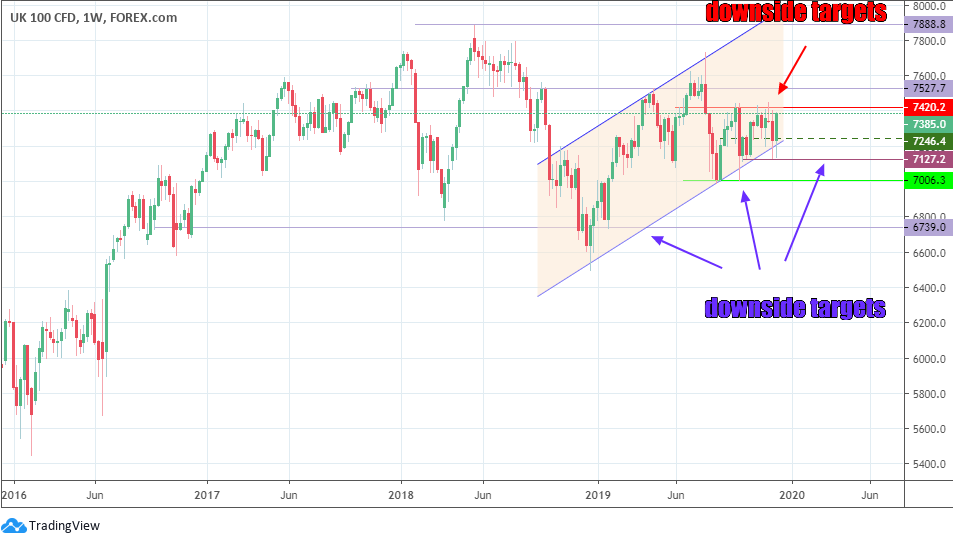
UK 100 Weekly Chart: December 13, 2019
Consequently, the support levels at 7006.3 (previous lows of Aug 25 and October 3) and also at 6739 (previous low of January 27) remain intact.
To the upside, the previous support-turned-resistance price level at 7246.4 has been taken out by the weekly candle’s bullish moves. Further ahead, we still have the previous resistance levels of 7527.7 (previous weekly candle highs of March 18, May 6, 13 and 20) and 7888.8 (previous high of May 18, 2018).
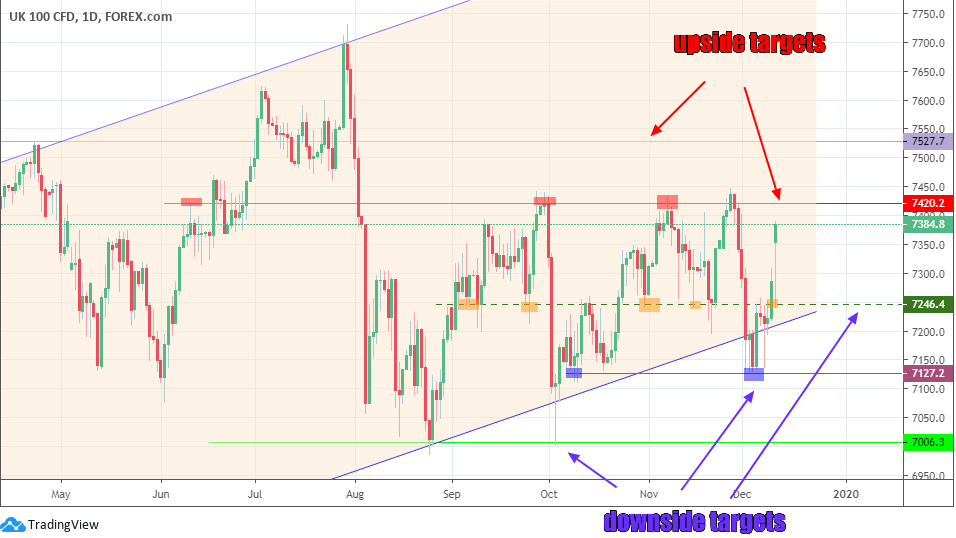
UK 100 Daily Chart: December 13, 2019
The daily chart provides a clearer picture of the current situation. The candles for Tuesday and Wednesday formed the classical pinbar reversal candles, which enabled price to bounce to the upside on Thursday as the election was being held. Today’s daily candle opened with a bullish gap which was covered by price action in the Asian session. However, as news filtered down that the Conservative Party had succeeded in capturing more than the 326 seats needed to get the parliamentary majority, price resumed its uptick and is now pushing towards the 7420.2 resistance line.
Two successive daily candle closes above the 7420.2 resistance, or a 3% penetration close above this price by the weekly candle will confirm the upside breakout. If this happens, the door will be open for the UK 100 to push for the next upside target at 7527.7. Above this level, further resistance will be seen at 7888.8 (May 21 2018 high). At this price area, the channel’s return line will also come under challenge.
On the flip side, a price rejection at 7420.2 opens the door for a pullback move towards 7246.4. Below this area, 7127.2 comes into focus once more.