The UK 100 had had a positive run this week, buoyed by UK GDP figures and manufacturing production data that showed that the UK economy was growing, buoyed by an increase in economic activity in the manufacturing sector. After having hit week highs of 7387.32, profit taking has set in and the UK 100 is now trading at 7337 (at the time of writing).
The UK 100 ’s gains earlier on Thursday could be attributed to the 2-week tariff reprieve granted to $250 billion worth of Chinese exports by US President Donald Trump. Investor sentiment was also boosted after British American Tobacco (BAT) announced plans to cut 2,300 jobs in a cost-cutting effort. The markets are also watching events from Europe, where the European Central Bank (ECB) is expected to resume its stimulus program.
Technical Analysis for UK 100
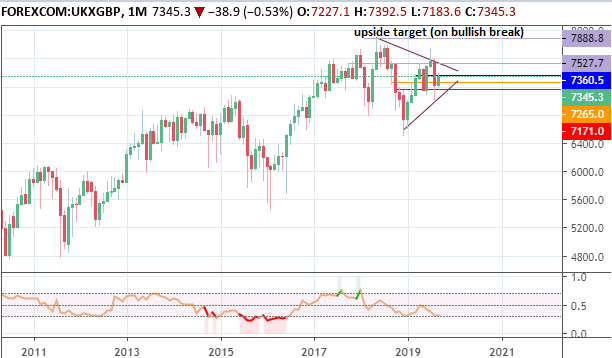
The long term outlook on the UK 100 remains unchanged. The UK 100 continues to form lower highs even as price forms higher lows, indicating that the long-term uptrend may have stalled. As a result of the price action, a symmetrical triangle has been formed and price may continue to trade within the borders until about 60% of the distance from the triangle’s base to its apex has been covered.
UK 100 Weekly Chart
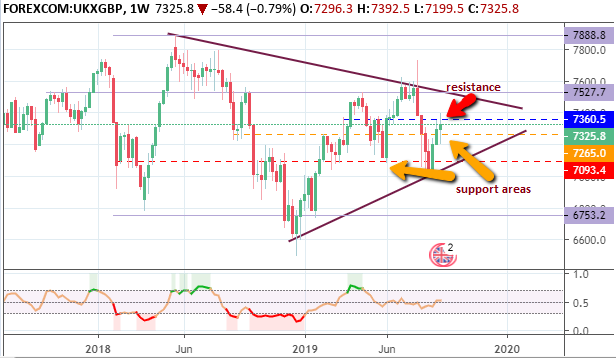
The medium-term outlook is seen on the weekly chart, where the UK 100 is flirting with a previously identified resistance at 7360.5. The weekly candle was able to achieve a high of 7387.32, but has retreated in today’s trading session and now rests at 7341.15 (as at the time of writing), which is slightly below the 7360.5 resistance level.
UK 100 Daily Chart
Bulls
Within the medium-term context of the triangle and the price levels contained within, a break above 7360.5 could lead the way for a push towards 7527.7 (Nov 2017 and April 2019 highs). The symmetrical triangle is a continuation pattern, so bulls would expect a break above the triangle, which would push it towards 7888.3 in the long term.
Bears
Bears would hope for a failed break of 7360.5, which could potentially open the door for attainment of 7265.0 in the medium-term. However, if price is able to break above 7360.5, there is still a possibility of price rejection at the medium-term resistance at 7527.7, located at the triangle’s upper border. Price rejection there would open the door for a run to the triangle’s lower border at 7093.4, with potential pit stops to be seen at 7360.5 (Nov 2017 low) and 7265.0 (Feb 2019 low) below it.
If the triangle turns out to be a topping pattern in the long term with a break of price below the triangle’s lower border, a possible run to 6753.2 (low of January 21, 2019) cannot be ruled out.
Prices to watch: 7360.5 (bulls) and 7265.0 (bears).
This research is produced by Accendo Markets Limited. Research produced and disseminated by Accendo Markets is classified as non-independent research, and is therefore a marketing communication. This investment research has not been prepared in accordance with legal requirements designed to promote its independence and it is not subject to the prohibition on dealing ahead of the dissemination of investment research. This research does not constitute a personal recommendation or offer to enter into a transaction or an investment, and is produced and distributed for information purposes only.
Accendo Markets considers opinions and information contained within the research to be valid when published, and gives no warranty as to the investments referred to in this material. The income from the investments referred to may go down as well as up, and investors may realise losses on investments. The past performance of a particular investment is not necessarily a guide to its future performance.