This report is not a personal recommendation and does not take into account your personal circumstances or appetite for risk.
Index Focus - 25 May 2017
Equity indices are positive as we dissect ongoing OPEC commentary from Vienna and despite Crude Oil price volatility. A 3% sell-off shortly after 9am highlights volatility, although note both Brent and US benchmarks staging a minor recovery. While a 9-month extension to production cuts is widely anticipated, comments from delegates are expected to move prices significantly and remain a driver throughout the day. The UK 100 underperforms as UK GDP marginally misses estimates, although remains above water as the translational benefit of a US dollar rally aids the UK’s majority foreign earning contingent alongside Germany’s plethora of exporters.
The UK 100 is buoyed by a Defensive mish-mash of BATS, ULVR, RB., RDS, NG. & AZN (US dollar rally), VOD (momentum trade) and select Banks HSBA & LLOY (US Fed rate hike expectation). This offsets losses contributed by BP (Oil volatility), RIO & AAL (Iron Ore/Copper weakness), BT (Exane downgrade) and BARC, GSK & DGE (investors rotating out of stocks).
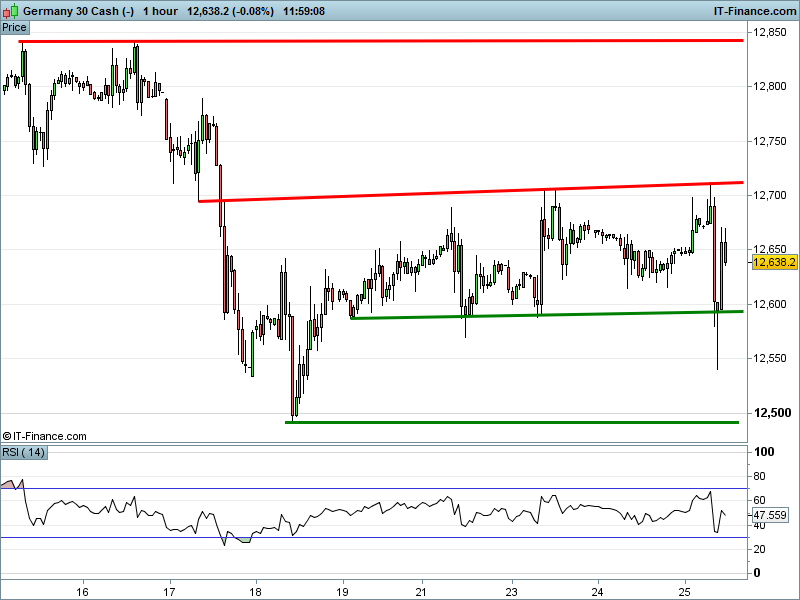
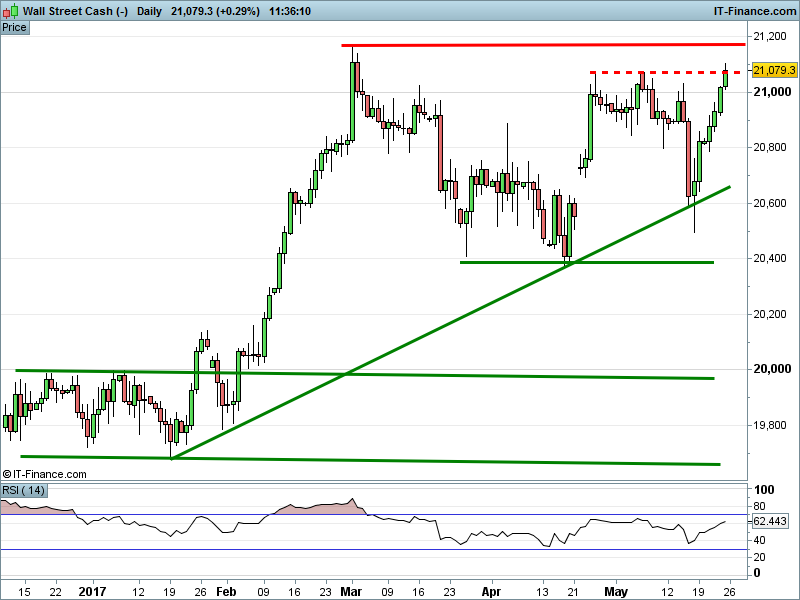
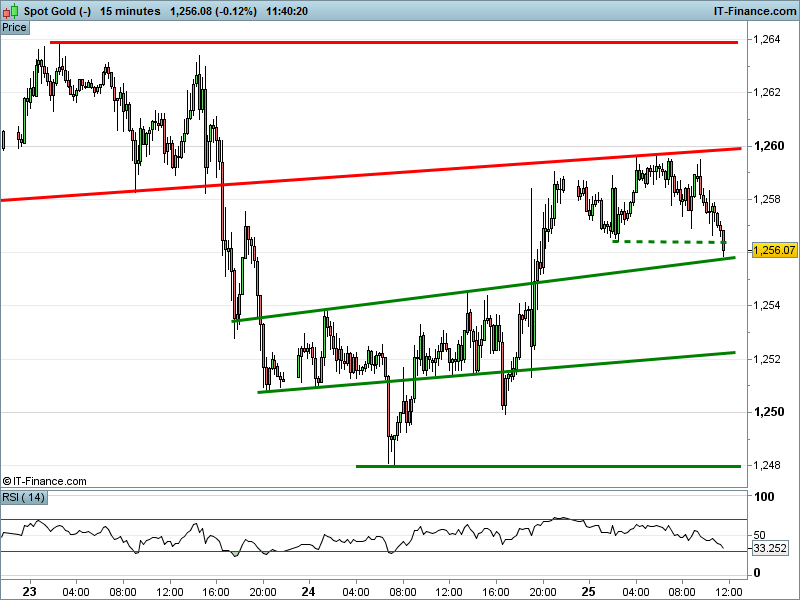
The UK Index 100 has recovered from a test of 7500 however is hampered by 7525 resistance. The DAX 30 has also staged a recovery from 12600 support, however is once again on the backfoot. Dow Jones Futures are testing April highs of 21070 for a march to all-time highs. Gold is testing support at $1256 following breakdown on account of USD strength.
Click below to expand sections for more detailed analysis
Where next?
- Will the index fall towards lows of 7475? or;
- Will the index rise towards highs of 7540?
The UK Index 100 has recovered from a test of 7500 however is hampered by 7525 resistance. OPEC-inspired breakout or breakdown?
Watch levels: Bullish 7530, Bearish 7515
Solid Green line
Possible support
Solid Red line
Possible resistance
- Trend: Uptrend
- Potential support: 7520, 7510, 7505, 7500, 7495, 7475
- Potential resistance: 7525, 7530, 7535, -
Important: The information provided above does not constitute advice or opinion and must only be regarded as technical observations.
Click here for help with Support & Resistance Click here for help with technicals
Where next?
- Will the index fall towards lows of 12,490? or;
- Will the index rise towards highs of 12,800?
The DAX 30 has also staged a recovery from 12600 support, however is once again on the backfoot. All the way back to support?
Watch levels: Bullish 12675, Bearish 12645
Solid Green line
Possible support
Solid Red line
Possible resistance
- Trend: Sideways
- Potential support: 12625, 12615, 12600, 12590, 12570, 12550
- Potential resistance: 12660, 12675, 12700, 12750, 12800
Important: The information provided above does not constitute advice or opinion and must only be regarded as technical observations.
Click here for help with Support & Resistance Click here for help with technicals
Where next?
- Will the index fall towards lows of 20,375? or;
- Will the index rise towards highs of 21,075?
Dow Jones Futures are testing April highs of 21070 for a march to all-time highs.
Watch levels: Bullish 21,095; Bearish 21,055
Solid Green line
Possible support
Solid Red line
Possible resistance
- Trend: Uptrend
- Potential support: 21060, 21020, 21000, 20980, 20960, 20920
- Potential resistance: 21090, 21100, 2140, 21171, -
Important: The information provided above does not constitute advice or opinion and must only be regarded as technical observations.
Click here for help with Support & Resistance Click here for help with technicals
Where next?
- Will Gold fall below lows of $1,248? or;
- Will Gold rise towards highs of $1,264?
Gold is testing support at $1256 following breakdown on account of USD strength.
Watch levels: Bullish $1257; Bearish $1255.5
Solid Green line
Possible support
Solid Red line
Possible resistance
- Trend: Sideways
- Potential support: 1256, 1255.5, 1254, 1252, 1251, 1250, 1248
- Potential resistance: 1257, 1258, 12630, 1263.5
Important: The information provided above does not constitute advice or opinion and must only be regarded as technical observations.
Click here for help with Support & Resistance Click here for help with technicals
Back to Top
This research is produced by Accendo Markets Limited.
Research produced and disseminated by Accendo Markets is classified as non-independent research,
and is therefore a marketing communication. This investment research has not been prepared in accordance
with legal requirements designed to promote its independence and it is not subject to the prohibition on
dealing ahead of the dissemination of investment research. This research does not constitute a personal
recommendation or offer to enter into a transaction or an investment, and is produced and distributed for information purposes only.
Accendo Markets considers opinions and information contained within the research to be valid when published,
and gives no warranty as to the investments referred to in this material. The income from the investments referred to may go down as well as up,
and investors may realise losses on investments. The past performance of a particular investment is not necessarily a guide to its future performance.
Prepared by Michael van Dulken, Head of Research